
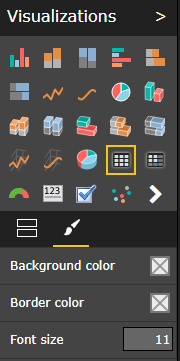
Changing the Font size in Table Visuals
Did you know that you can easily change the font size in Table Visuals in Dynamic views ?
Information Delivered™
Did you know that you can easily change the font size in Table Visuals in Dynamic views ?
The latest version of EnhancedBI has added a Union Mode to the AS400 connector
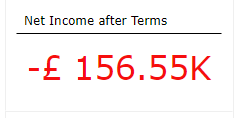
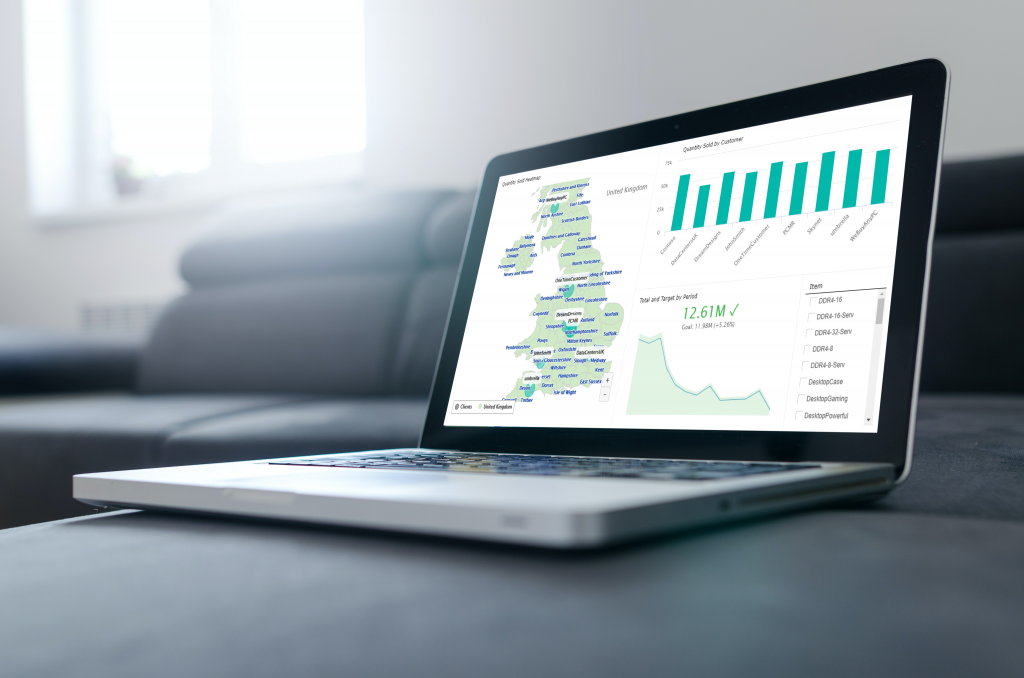
Using Dynamic Views, you see the change as the data changes, and if there is an issue, the colour will alert you
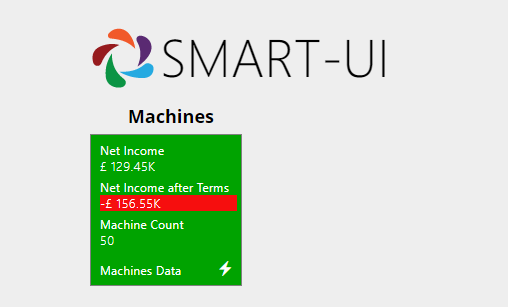
Now you can review all of your key performance figures directly from the HomeScreen at any time -you are in control. As you can see, any negative numbers are automatically highlighted in red.
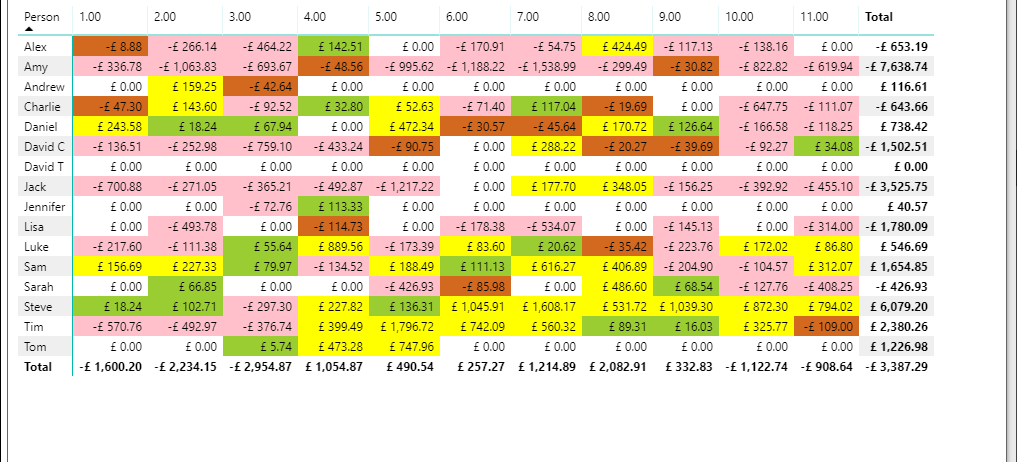
Here is another way to see, using our Matrix Visual, at a glance, how you are doing in your business or club.
The latest updates to Enhanced BI (Smart-UI) have been released. The changes are: – added the ability to set a negative colour in Card Visuals – added the ability to change font size in Table Visuals – added a page count indicator to Table Visuals – fixed an issue with sorting data by renamed fields…
Read more
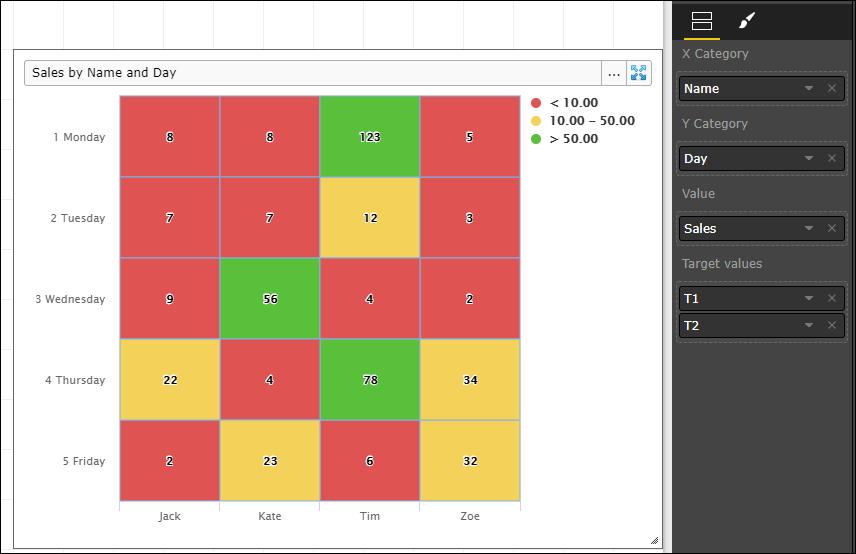
Using our Heat Map Visual will enable you to see, at a glance, how your company or department is doing against your targets and budgets.
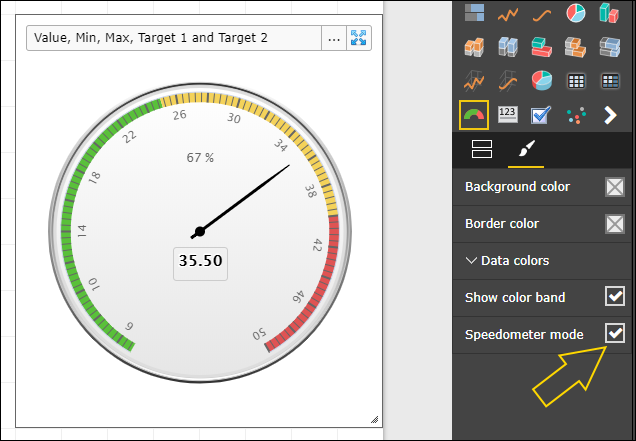
The new Speedometer visual enables colour selections for your different data feeds
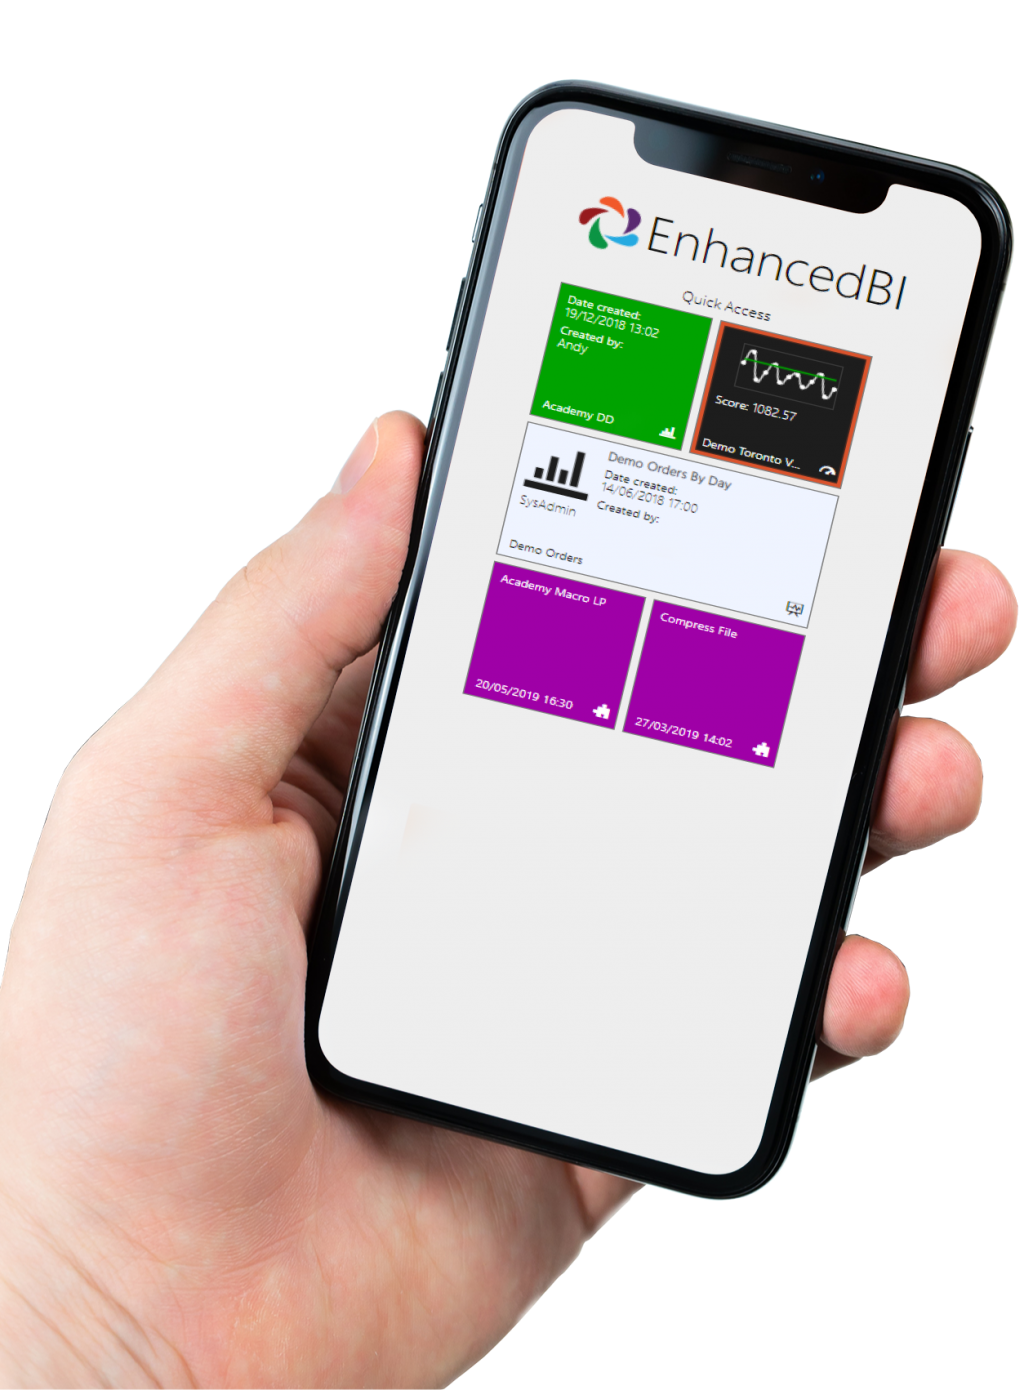
For those ‘out of the office’ moments stay connected to your important insights through EBI-Mobile
For those ‘out of the office’ moments stay connected to your important insights through EBI-Mobile