
Seeing performance at a glance
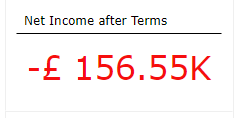
Using Dynamic Views, you see the change as the data changes, and if there is an issue, the colour will alert you
Information Delivered™
Using Dynamic Views, you see the change as the data changes, and if there is an issue, the colour will alert you
The latest version of EnhancedBI has been released. The changes are: – added the ability for HeatMap Visuals to be filtered using KPI Visuals, Table Visuals and Search Visuals – added the ability for KPI Visuals to be filtered using Table Visuals and Search Visuals – enhanced checking in EPs for exporting nulls instead of…
Read more
The latest version of EBI’s Smart UI has been released. The changes are: – added the Speedometer Mode to the Gauge Visual – enhanced the Gauge Visual on mobile devices The option to toggle the Speedometer Mode is available on the “Format” tab.
The latest version of EBI’s Smart-UI has been released. This delivers a new Gauge Visual to the Dynamic View section which has the capability to display multiple target values, it can also enable the setting of customised colours for the targets and can have a colour band displayed around the gauge to highlight the target…
Read more